What is the Gini coefficient? Lorenz curve
GINI COEFFICIENT, an indicator used in statistics to assess the degree of concentration of the characteristic being studied or the unevenness of its distribution among units or groups of units of the statistical population. The concentration of the relative volumes of a characteristic in individual units accordingly leads to a proportional decrease in the relative volumes in the units of the remaining part of the population, which causes uneven distribution. Such unevenness may occur in the distribution of income across population groups, labor resources by region of the country, assets by credit institutions and so on. Along with the term "concentration" in specific subject areas Other terms are also used, such as "localization" or "differentiation".
The calculation of the Gini coefficient is based on the use of a concentration curve (Lorentz curve). To construct it, it is necessary to have a frequency distribution of units of the population under study and an interconnected frequency distribution of the characteristic being studied. At the same time, for the convenience of calculations and to increase the analyticality of the data, the population units, if possible, are divided into equal groups: 10 groups - 10% of units each or 5 groups - 20% of units each. So, for example, in the practice of statistics, when studying the differentiation of the population by income, 5 groups are distinguished according to the degree of their increase: the first - with the lowest incomes, the fifth - with the highest.
The Lorenz curve is plotted in a rectangular coordinate system. The accumulated frequencies of the volume of the population are plotted on the abscissa axis, and the accumulated frequencies of the volume of the attribute are plotted on the ordinate axis. The resulting curve will characterize the degree of concentration.
General view of the Lorenz curve.
If the distribution is strictly uniform, then the first 20% of units of the ranked population (population) have 20% of the volume of the attribute (total income), the first 40% of units have, respectively, 40% of the volume of the attribute, etc. This distribution is displayed by a straight line passing from the lower left corner of the graph to the upper right corner and is a line of uniform distribution. The stronger the concentration of the characteristic being studied, the more noticeably the Lorenz curve deviates downward from the line of uniform distribution, and vice versa, the weaker the concentration, the closer the curve will be to a straight line.
The degree of concentration (figure) is determined by the area of figure A, limited by the line of uniform distribution and the Lorenz curve. How larger area A and the correspondingly smaller the area B, the higher the degree of concentration. By comparing area A with the area of a triangle located below the line of uniform distribution, the Gini coefficient is based, the calculation formula of which is:

where d xi is the share i-th group in the total volume of the population; d yi - i-th share groups in the total volume of the characteristic; d H yi is the accumulated share of the i-th group in the total volume of the attribute.
The range of values accepted by the Gini coefficient is from 0 to 1. According to Federal service state statistics, the Gini coefficient, which characterizes the differentiation of the Russian population by income, was 0.387 in 1995, and 0.407 in 2004. IN Russian Federation The Gini coefficient began to be used only in the 1990s, and as during economic crisis 1990s, and during economic growth 2000s showed low egalitarianism (from the French égalité - equality) Russian society.
The manual is presented on the website in an abbreviated version. This version does not include testing, only selected tasks and high-quality assignments are given, and theoretical materials are cut by 30%-50%. I use the full version of the manual in classes with my students. The content contained in this manual is copyrighted. Attempts to copy and use it without indicating links to the author will be prosecuted in accordance with the legislation of the Russian Federation and the policies of search engines (see provisions on the copyright policies of Yandex and Google).
14.2 Lorenz curve and Gini coefficient
Lorenz curve reflects the cumulative (accumulated) shares of the population's income. It is most convenient to consider the construction of the Lorenz curve using the following example:
Let's imagine an economy consisting of 3 agents: A, B, C. Agent A's income is 200 units, agent B's income is 300 units, agent C's income is 500 units.
To construct the Lorenz curve, we find the shares of individuals in total income. Total income is 1000. Then person A's share is 20%, B's share is 30%, C's share is 50%.
Individual A's share of the population is 33%. His income share is 20%.
Then we will include in the analysis a richer individual—individual B.
The combined share of A+B in the population is 67%. The joint share of A+B in income is 50% (20%+30%).
The combined share of A+B+C in the population is 100%. The joint share of A+B+C in income is 100% (20%+30%+50%).
Let us note the results obtained on the graph:
The line connecting the lower left point and the upper right point of the graph is called line of uniform income distribution. This is a hypothetical line that shows what would happen if income in the economy was distributed evenly. At uneven distribution income, the Lorenz curve lies to the left of this line, and the greater the degree of inequality, the stronger the bend in the Lorenz curve. And the lower the degree of inequality, the closer it is to the line of absolute equality.
In our case, the Lorenz curve looks like a piecewise linear graph. This happened because in our analysis we identified only three population groups. As the number of population groups considered increases, the Lorenz curve will look like this:

The Lorenz curve allows you to judge the degree of income inequality in the economy by its bend. To quantify the degree of income inequality along the Lorenz curve, there is a special coefficient - the Gini coefficient.
The Gini coefficient is equal to the ratio of the area of the figure bounded by the straight line of absolute equality and the Lorenz curve to the area of the entire triangle under the Lorenz curve.

If the Lorenz curve is depicted not in %, but in fractions, then the area of the large triangle is always equal to ½. The formula for the Gini coefficient for this case takes the form:
J = 2 * S A
The Gini coefficient can take values from 0 to 1. The closer the Gini coefficient is to zero, the smaller the bend in the Lorenz curve, and income is more evenly distributed. The closer the Gini coefficient is to one, the greater the bend in the Lorenz curve, and income is less evenly distributed.
Let's calculate the Gini coefficient for our example with three individuals. To do this, we will construct the Lorenz curve in fractions, and not in % 1.

The fastest way to calculate the area of the inner figure D is by subtracting the areas of figures A, B and C from the area of the large triangle.
In this case, the Gini coefficient will be equal to:
![]()
A special case of the Lorenz curve and the Gini coefficient: pairwise comparison.
As you know, any statistical indicator has its flaws. Same as for GDP indicator it is impossible to judge the level of well-being of an economy, and the Gini coefficient (and other indicators of the degree of inequality) cannot give a fully objective picture of the degree of income inequality in the economy.
This happens for several reasons:
- First, individuals' income levels are not constant and can change dramatically over time. The income of young people who have just graduated from university is usually minimal, and then begins to increase as the person gains experience and builds up human capital. People's income typically peaks between the ages of 40 and 50, and then declines sharply as the person retires. This phenomenon is called the life cycle in economics.
But a person has the opportunity to compensate for differences in income at different stages of the life cycle with the help of financial market– taking out loans or making savings. Thus, young people at the very beginning of their life cycle willingly take out loans for education or mortgage loans. People who are closer to the end of the economic life cycle are active savers.
The Lorenz curve and Gini coefficient are not taken into account life cycle, so this measure of the degree of income inequality in a society is not an accurate estimate of the degree of income inequality. - Second, individuals' incomes are affected by economic mobility. The US economy is an example of an economy of opportunity, where an individual from the bottom can, through a combination of hard work, talent and luck, become a very successful person, and history knows many similar examples. But there are also cases of loss of large fortunes or even complete bankruptcies of quite wealthy entrepreneurs. Typically, in economies such as the United States, an individual household will move through several income distribution categories over the course of its lifetime. And this is due to high economic mobility. So, for example, a household may be included in the lowest income group one year, and in the middle income group the next year. The Lorenz curve and the Gini coefficient also do not take this effect into account.
- Third, individuals can receive transfers in in kind, which are not reflected in the Lorenz curve, although they affect the distribution of individual income. Transfers in kind can be implemented in the form of assistance to the poorest segments of the population with food and clothing, but usually they are provided in the form of numerous benefits (free travel on public transport, free trips to sanatoriums, and so on). Taking into account such transfers economic situation the poorest segments of the population are improving, but the Lorenz curve and the Gini coefficient do not take this into account. Not so long ago in Russia many benefits were monetized, and it became easier to calculate the objective incomes of the poorest segments of the population. Consequently, the Lorenz curve began to better reflect the real distribution of income in society.
These indicators are used to assess the degree of income inequality, and are included in the field of positive economic analysis. Let us recall that positive analysis differs from normative analysis in that positive analysis analyzes the economy objectively, as it is, and normative analysis is an attempt to improve the world, to make it “as it should be.” If the assessment of the degree of inequality is a positive economic analysis, then attempts to reduce inequality in the distribution of income belong to the field of normative economic analysis.
Normative economic analysis known for the fact that different economists can offer different, often diametrically opposed recommendations for solving the same problem. This does not mean who is more competent and who is less competent. This only means that economists start from different philosophical views on the concept of justice, and there is no unity on this issue.
First we will look at the various existing systems values, and then show how income can be distributed more equitably within each system.
The materials in this section are not published on the website, but are available in the full version of this manual, which I use in classes with students.
Taxes and tax system
The US economy of the 19th century can be said to be an ideal example of free capitalism. Adam Smith's ideals of minimal government intervention in the distribution of resources and the functioning of markets (remember the famous principle of laissez faire) were adopted at that time, government intervention in the market was minimal, government spending amounted to 7-8% of total expenses, and average rate taxation for US citizens was 5% of income. The entire 20th century passed under the banner of an active increase in the presence of the state in the economy, government spending increased to 25%-30% of total expenses, and the average tax rate increased to 35% of income.
The state now acts not only as an eliminater of market failures, which we actively discussed in the last chapter (externalities and the provision of public goods), but also as a stimulant of the economy when the economy is experiencing difficult times.
Taxes are the main source of government revenue. Any state has many taxes and fees based on certain principles, as well as tax collection control institutions. All this amounts to state tax system.
Principles are used to evaluate the tax system efficiency and fairness. As we already know, the concept of justice is not precisely defined for economists. Depending on the system of moral values, justice can be established in one way or another. Economists are much more consistent in defining what efficiency is. An effective tax system is one that least of all leads to distortion of incentives for market participants and, consequently, to the occurrence of deadweight losses.
Let us show how deadweight losses are associated with distorted incentives for market participants.
On the topic of market equilibrium, we remember that deadweight losses occurred when taxes and subsidies changed the position of the supply and demand curves, that is, they changed the economic behavior of people. The deadweight loss was that some buyers were unable to buy the good and some producers were unable to sell the good, compared to a situation where prices accurately reflected marginal costs.
Let's consider a simple example: individual A values the pleasure of consuming ice cream at 60 rubles, individual B - at 40 rubles. If the price of a glass of ice cream is 30 rubles, then each of them will buy it and enjoy it. The amount of consumer surplus will be equal to 40 rubles (30 rubles for individual A and 10 rubles for individual B). If we introduce a tax on ice cream consumption in the amount of 20 rubles per glass, then the situation on the market will change dramatically: individual A will still consume ice cream, but individual B will refuse to consume it. The total consumer surplus will now be equal to only 10 rubles (this is the surplus of individual A). Tax fees this will amount to 20 rubles (again, only individual A will pay them), and the state receives them. The amount of public benefits in this case will be 10 + 20 = 30 rubles, and it is 10 rubles lower than in a situation without taxation. On this simple example We were convinced that during taxation there was a permanent loss in the amount of 10 rubles. And they arise because individual B changed his economic behavior, completely abandoning the consumption of ice cream.
In the same way, any taxes lead to deadweight losses, so we can safely say that any taxes are ineffective in this sense. The task of economists is to find taxes that will minimally distort people's incentives, and therefore lead to minimal deadweight losses.
Taxes may apply differently depending on the amount of income. In order to do this, we will need two types of tax rates: average tax rate and marginal tax rate.
The average tax rate shows what percentage of tax an individual pays on average on income received
The marginal tax rate shows what percentage of tax an individual pays on additional income:
![]()
The average and marginal rates behave the same as any average and marginal values:
- When the marginal rate is higher than the average, the average rate increases
- When the marginal rate is lower than the average, the average decreases
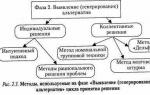
Depending on the behavior of the average and marginal tax rates, there are 3 types of taxes: progressive, proportional, regressive.
Have a progressive tax The average tax rate rises as income increases, which means the marginal tax rate is higher than the average.
Examples of progressive taxes: income taxes in France, taxes in Sweden, car tax in Russia.
Have a proportional tax The average rate does not change with income growth, which means that the average tax rate coincides with the marginal tax rate.
Examples of proportional taxes: income tax in Russia 13%, profit tax in Russia 20%.
If an individual is offered the same tax rate while there is a certain tax-free minimum (or is provided tax deduction), then this tax system is no longer proportional, but progressive. At first, an individual does not pay taxes at all, and then, after exceeding the tax-free minimum, he begins to pay tax at the same rate.
Have regressive taxes The average rate falls as income increases, which means the marginal tax rate is lower than the average.
Examples of regressive taxes: excise taxes - since a person pays them when purchasing a product, regardless of his income. For example, from 10 to 30 rubles in the cost of each pack of cigarettes are excise taxes, and a person pays them regardless of the amount of income when purchasing each pack of cigarettes. Thus, for a poor person this tax constitutes a significant part of his income, but for a millionaire it will be insignificant.
Other examples of regressive taxes are any fixed taxes or duties. For example, in the Russian Federation, a person is forced to pay a fixed fee of about 1,000 rubles when registering a car license plate. This type of tax is regressive because the duty leaves more of the income for the poor person and less of the income for the rich person.
Which of these types of taxes is fairer? A popular point of view is that progressive taxes are more fair, and regressive taxes are less fair. But this point of view is wrong. As we showed earlier, everything depends on within what system of moral values we will talk about justice.
Let's look at a simple example. Individual A receives an income of 10 rubles and pays tax at a rate of 10%. Individual B receives an income of 90 rubles and pays tax at a rate of 5%. The tax scale is regressive - the average rate falls as income rises. But is it unfair? Let's calculate the amount of tax paid by each individual. Individual A pays 1 ruble (=10*10%), individual B pays 4.5 rubles (=90*5%). As a result, the individual who earns more pays and a large amount tax And where is the injustice here?
To assess the fairness of the tax system, the following postulates are highlighted:
- Principle of benefits received: individuals must pay taxes in accordance with the benefits they derive from government services. The idea that rich people should pay more taxes than poor people may be based on this principle. Because the government is the provider of public goods and the guarantor of property rights, rich people benefit more from the government than poor people because they have more property. This principle also justifies the idea of anti-poverty programs at the expense of the rich. We all want to live in a society that does not experience revolutions and social upheavals due to the unacceptable standard of living of the poorest segments of the population. Therefore, the idea of helping the poor at the expense of the rich seems justified.
- Solvency principles: horizontal equity and vertical equity. Horizontal equity means that individuals with the same income should pay the same taxes. Vertical equity means that individuals with higher incomes must pay higher taxes. As we saw from the example above, these principles can be met not only by a progressive taxation system, but also by a regressive one.
Depending on how taxes are collected in the state budget, distinguish direct and indirect taxes.
Direct taxes- These are taxes that are paid by the person who bears the tax. For example, income tax is a direct tax because it is paid by the firm that receives those profits. Income tax is a direct tax because it is paid by the individual who receives taxable income.
Indirect taxes- These are taxes paid by someone who is not a tax bearer. For example, excise taxes on alcohol and cigarettes are paid by firms. However, the bearer of the tax in this case is the consumer, because excise taxes “sit” in the price of goods purchased by the consumer. Indirect taxes in Russia are VAT (value added tax) and excise taxes. All indirect taxes are regressive with respect to the income of buyers.
Which taxes are more popular: direct or indirect? The answer is that indirect taxes are easier to collect because they are actually imposed on consumer spending. Direct taxes are more difficult to collect because they are imposed primarily on income, in which case individuals have incentives to evade taxes by hiding income. Therefore, indirect taxes are more popular in states with underdeveloped institutions, where individuals are able and willing to evade taxes.
Another effect that direct or indirect taxes have on the economy is to encourage individuals to save. Direct taxes are usually imposed on individuals' current income, so individuals have no incentive to save more. Indirect taxes encourage individuals to save because these taxes are imposed on consumption. By saving money rather than spending it now, individuals pay less in taxes now at indirect taxes, and pay more taxes now with direct taxes.
The Impact of Taxes on Income Inequality
The materials in this section are not published on the website, but are available in the full version of this manual, which I use in classes with students.Gini coefficient. Income inequality
Gini coefficient (Gini index) - a statistical indicator indicating the degree of stratification of the society of a given country or region in relation to any studied characteristic (for example, by level annual income- the most common application, especially in modern economic calculations). The Gini coefficient can be used to reveal the level of inequality in accumulated wealth.
This statistical model was proposed and developed by the Italian statistician and demographer Corrado Gini (1884–1965) and published in 1912 in his famous work Variation and Variation of Character (Variability and Inconstancy). Thus, this is a macroeconomic indicator characterizing differentiation cash income population in the form of the degree of deviation of the actual distribution of income from their absolutely equal distribution among the inhabitants of the country.

Gini coefficientdetermines the degree of distribution deviationincome by population groups from uniform. The closer it is to zero, especially equal distribution of income; the closer the Gini coefficient is to one, the more income is concentrated by the richest group of citizens. For example, the Gini coefficient in the USA is 0.408, in the UK - 0.361, in Sweden - 0.250, in Japan - 0.249, in Zimbabwe - 0.568, in Mexico - 0.537, in Chile - 0.565. European bloc countries such as the Czech Republic, Sweden, Norway, Denmark, Slovenia have a lower Gini coefficient, ranging from 0.2 to 0.3.

According to some estimates, one sixth of the Russian population concentrated in their hands 57% of all monetary income and 92% of property income. The model of social stratification that has developed in Russia today characterizes highest degree differentiated society.
There is a concept decile income differentiation coefficient, which shows how many times the minimum income of the richest 10% of the population exceeds maximum income among the bottom 10% of the population. In 1991, the decile coefficient was 4.5 times; in 1992 - already 8.0 times; in 1994, its record value was observed for the entire period of reforms - 15 times, in last years- on average 14 times. The Gini coefficient in Russia in 1991 was 26%, in 1992 - 28.9%, in 1994 - 40.9%, in 1998 - 37.9%, in recent years its value has averaged 39% (2008 data).

World practice confirms that the danger of social conflicts is minimized if the gap between the incomes of rich and poor does not exceed 10 times.
The upper layer of Russian society is heterogeneous, it includes members of the government involved in economics; ministers and their deputies; heads of the largest state and semi-state companies; heads of new commercial structures; economic consultants public organizations; leading scientists and economists; persons collaborating with or belonging to the criminal world, highly qualified specialists. Among rich people, more than half are first-level managers. In the pre-reform period, high official position ensured the possibility of control over property and the right to privileges, and today - the appropriation of property and income.
Elite from the French elite - “the best, selected part.” In the theory of elites, economic, political and spiritual elites are distinguished. The economic elite refers to people who receive high and ultra-high incomes and control the main financial and economic structures of the country, regardless of their form of ownership. Almost all theories of elites are associated with the system of power relations in society and note inequality between the elite and all other members of society. In other words, the elite are the leading representatives of society, determining the priorities for the development of society and influencing the bulk of the population. The economic elite includes persons occupying leading positions in economic, political and social structures who have and are aware of common interests and interact with each other. P . According to most experts, the economic elite of Russian society should include the gas, oil and aerospace groups. The coal, gold, and banking groups are called proto-elites, noting their powerful potential in the absence of constant intra-group interaction and contacts.
The overwhelming majority of the country's citizens perceive the emergence and constant increase in the number of dollar billionaires against the background of poverty of a significant part of the population as a blatant anomaly. With a GDP per capita of $17 thousand, approximately 13 percent of people in Russia live below the poverty line, which, according to experts, is almost nonsense. Especially when you consider that the share shadow economy in our country remains quite high - 25-30 percent. This money is not taken into account in GDP, which means that its real level is higher than the official one. At the same time, most of the income from the shadow sector goes to people who are not poor, and, therefore, the real stratification of society is higher.
One way to eliminate income inequality involves government support for health, welfare, and education systems. In this case, people with lower incomes can obtain satisfactory physical condition, confidence in the future and education. This approach provides the necessary conditions for life to everyone. Another way to combat inequality involves changes in tax system and, in particular, the system of progressive income tax. In this regard, there is a significant difference in the applicable rules of different countries, the range of interest rates in different countries is different. In the USA, income tax rates are set by the government in the range of 10% - 35%, in Japan - 5% - 50%, in Canada - 15% - 29%. Only in Russia interest rate income tax is the same for everyone - 13%, which leads to the fact that there are no demarcating boundaries in the income of different segments of the population, and the rich become richer, and the poor become even poorer.
The number of Russian millionaires whose wealth exceeds $100 million will grow by 76 percent by 2017. This forecast was published in a report by the consulting company Knight Frank and Citi Private Bank.
Now in our country there are 2.1 thousand such centa-millionaires. And all over the world - 63 thousand people. Their total wealth is estimated at $39.9 trillion.